

Have you ever wondered what the general sentiment is around hot topics like presidential candidates, tech moguls, or economic trends?
Sentiment analysis often pops up in discussions about elections, product launches, or market movements. It’s one of those buzzwords that used to feel distant — something for data scientists with complex models to handle.

But thanks to GenAI, sentiment analysis feels much more accessible now. Armed with powerful models like DistilBERT, I decided it was time to give it a go and see what the world is talking about.
Welcome to Project 4 of my GenAI Challenge: building a Sentiment Analyzer for trending topics!
Project Goals
The goal of this project was to create a program that could:
Collect discussions: Pull data from online platforms (like Reddit or news articles) to analyze public opinions.
Analyze sentiment: Use a zero-shot language model for sentiment classification.
Interpret results: Organize and make sense of sentiment data in a meaningful way.
Ultimately, I wanted to understand the mood surrounding key topics like Bitcoin, Trump, Elon Musk, and interest rates — and learn something new about public sentiment analysis.
Choice of Data Sources and Models
1. Finding the Right Data Source
Initially, I planned to use X (formerly Twitter) as my primary data source. However, I hit an unexpected roadblock: X’s Developer API application process is buggy for me — the text box keep asking for use-case explanations despite my input and wouldn’t let me submit. If you’ve successfully applied for X’s API recently, let me know!
So I turned to more friendly (and reliable) platforms:
Reddit: A treasure trove of discussions with rich user-generated content.
News API: A great source for accessing up-to-date articles from global publications.
2. Selecting a Sentiment Model
I opted for DistilBERT, a smaller and faster version of BERT, which is ideal for sentiment analysis. It’s lightweight enough to run on my local machine yet powerful enough to deliver meaningful results. Hugging Face’s Transformers library made integration easy, allowing me to load and fine-tune the model with minimal effort.
I have a complete article discussing the sentiment analysis models. Check it out here:

Help from Cursor (As Always)
Cursor, my coding companion, made light work of the setup:
It quickly wrote the code to connect to Reddit and News API, fetched the latest 100 posts from Reddit, and retrieved news from the past 7 days.
It handled most of the sentiment analysis pipeline with minimal manual intervention.
The only hiccups were dependency compatibility issues (easily resolved) and setting up API credentials, which took the most time.
Stages of Analysis
Stage 1: Initial Sentiment Analysis
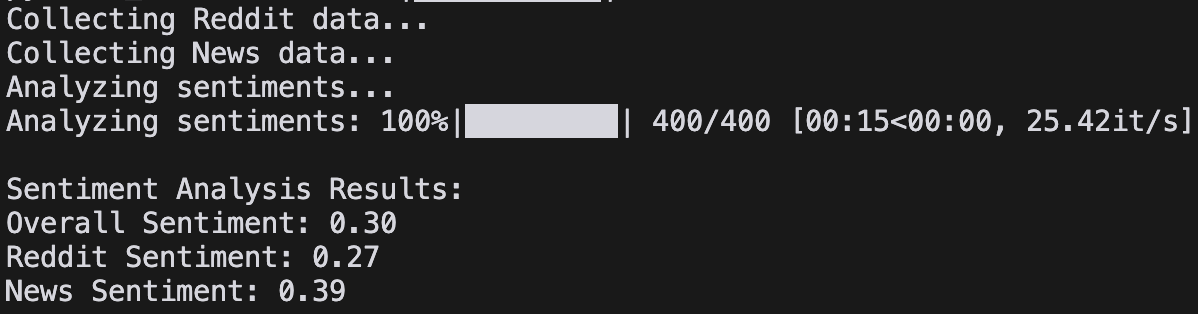
I started by running python main.py and got my first set of sentiment scores. Here’s a quick sentiment scoring primer:
Scores typically range from 0 to 1 (or -1 to +1 in some systems):
Closer to 1: Positive sentiment.
Around 0.5: Neutral sentiment.
Closer to 0: Negative sentiment.
From the initial analysis, it seems that people generally have a negative attitude toward Bitcoin. What do you think — do you agree with that assessment?
To further test the model and validate its analysis, I applied it to three topics: Trump, Elon Musk, and interest rates. Here are the results:
For Trump:
Overall Sentiment: 0.27
Reddit Sentiment: 0.26
News Sentiment: 0.37
For Elon Musk:
Overall Sentiment: 0.33
Reddit Sentiment: 0.32
News Sentiment: 0.41
For Interest Rates:
Overall Sentiment: 0.18
Reddit Sentiment: 0.18
News Sentiment: 0.21
What’s your take on these results? Do they align with your expectations?
Stage 2: Understand Sentiment Scores
I generally agree with the trend in the analysis: interest rates show the most negative sentiment, while Elon Musk and Bitcoin appear to have slightly more positive sentiment than Trump.
However, overall, I found the sentiment scores to be lower than what I expected based on what I’ve read online. Of course, it’s entirely possible that my online readings are biased and don’t reflect the broader sentiment accurately.
Using DistilBERT’s binary classification output, the sentiment scores are normalized between 0 and 1. According to Umbrex’s sentiment analysis guide, typical sentiment scores vary by industry:
E-commerce: 0.2 to 0.6
B2B SaaS: 0.3 to 0.7
Travel: 0.5 to 0.8
Food & Beverage: 0.1 to 0.5
This suggests that consistently seeing scores below 0.4 might actually be normal, depending on the industry or context. Upon further reflection, I realized that controversial topics discussed online often have a bias toward the lower end of the sentiment scale. It’s not surprising, then, that the scores for all the topics I analyzed are below 0.5.
Stage 3: Comparing Mean, Median and Standard Deviation
But wait a second — when I used mean values for all the Reddit posts and news articles, I started wondering: where do the median values fall? And what about their standard deviations?
Take a look: the median values are significantly smaller than the means across all four analyses. Isn’t that fascinating?
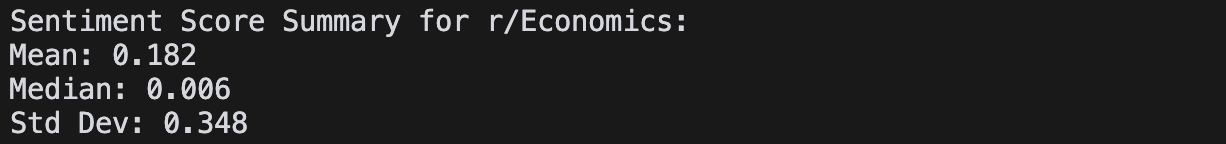
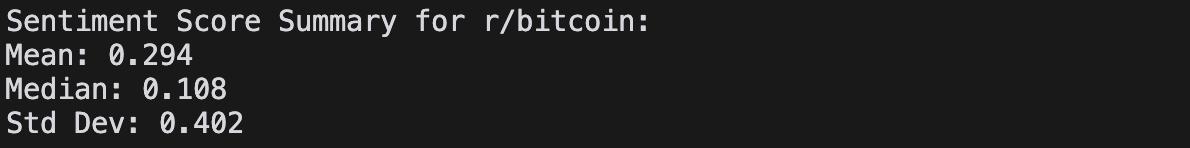
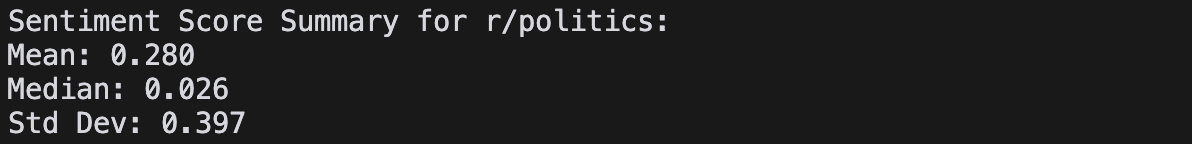
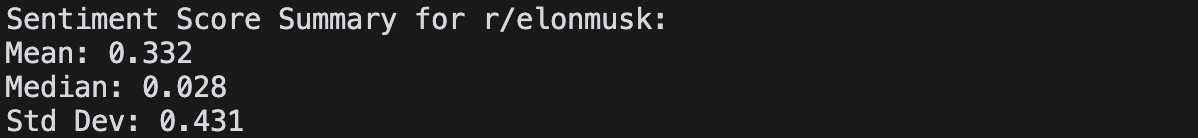
The difference between the mean (typically >0.2) and the median (often <0.1) suggests a right-skewed distribution, which indicates:
Many low scores (negative sentiments) are pulling the median down.
A few very high scores (positive sentiments) are pulling the mean up.
This kind of pattern is typical for controversial topics, where:
There’s a large base of negative sentiment, reflected in the low median.
A smaller but vocal group of supporters generates very positive content, raising the mean.
Topic-Specific Patterns:
For subjects like Bitcoin, Elon Musk, Trump, and interest rates, this makes sense:
A high volume of critical or negative content explains the low median.
Positive content from strong supporters pulls the mean upward.
Sentiments within single documents often mix positivity and negativity.
Sarcasm and complex opinions add further layers to the sentiment distribution.
This analysis highlights how public discourse on divisive topics often reflects polarized perspectives rather than a balanced consensus.
Visualizing the Sentiment
Now I’m motivated to dig deeper and understand what’s truly going on. The simplest way to start is by plotting the distribution of all sentiment scores — and let me tell you, the results are mind-blowing.
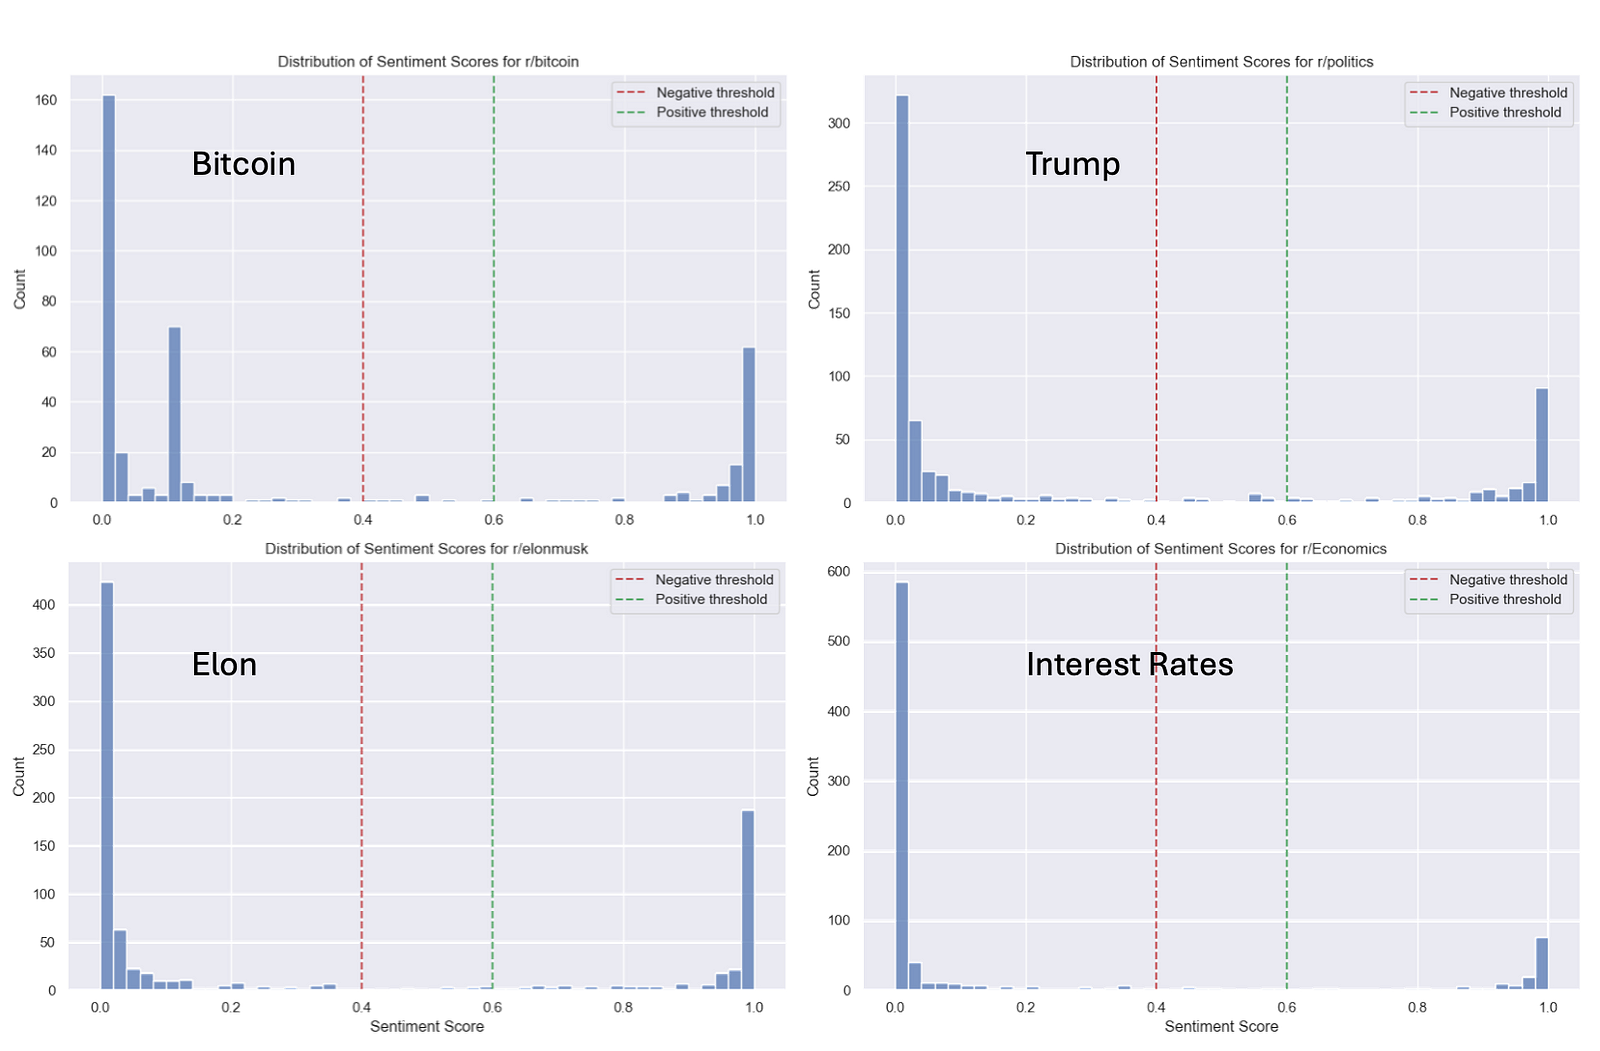
Based on sentiment analysis theory and my findings, a bimodal distribution (high counts at 0 and 1, with low counts in the middle) is actually quite common in sentiment analysis. However, it’s not necessarily ideal. Here’s why:
Model Behavior:
The sentiment model seems to make more confident predictions toward the extremes (0 or 1).
This behavior suggests the model may be overly polarized in its predictions, interpreting sentiments as either strongly positive or strongly negative, with little room for subtlety.
Potential Issues:
According to insights from Stack Exchange, a bell-shaped distribution (centered around neutral scores) typically indicates more nuanced and balanced predictions.
The current bimodal distribution might indicate that the model is:
Missing subtle or neutral sentiments.
Oversimplifying complex opinions.
Failing to capture the full spectrum of sentiment in the data.
This raises some important questions about how the model processes mixed or ambiguous sentiments and highlights areas for improvement in future iterations.
Two Widely-Loved Female
Just for the fun of it, I tried sentiment analysis on Audrey Hepburn and Taylor Swift. Here are the results:
For Taylor Swift:
Mean: 0.496
Median: 0.470
Standard Deviation: 0.462
For Audrey Hepburn:
Mean: 0.520
Median: 0.662
Standard Deviation: 0.464
While their scores are still lower than I initially expected, they are noticeably higher than the scores for the four previously tested topics (Trump, Elon Musk, interest rates, and Bitcoin). This suggests that discussions around Audrey Hepburn and Taylor Swift tend to have a more positive sentiment overall.
The higher median for Audrey Hepburn (0.662 compared to a mean of 0.520) indicates that a larger portion of posts lean positively, even though there are some outliers pulling the average down. For Taylor Swift, the mean and median are closer, showing a more balanced sentiment distribution with a mix of opinions.
This reinforces my trust in the sentiment analysis model, as the results align well with what one might expect: less polarizing, more positively viewed figures tend to generate higher sentiment scores. It’s fascinating to see how sentiment differs across topics, and it’s tempting to dive even deeper into fan communities or celebrity discussions to uncover more insights!
Problems and Improvements
While I’m generally satisfied with the outcome, you can still see some problems:
Model Refinement: DistilBERT is excellent for general sentiment analysis, but fine-tuning it on Reddit and news data could improve its understanding of specific topics.
Score Normalization: Adjusting for skewed distributions could make the sentiment scores more accurate for controversial topics.
Keyword Selection: My chosen keywords were arbitrarily handpicked and may not fully capture the range of opinions. A more systematic approach (like topic modeling) could broaden the analysis.
Nuanced Sentiments: The bimodal distribution suggests the model misses neutral or complex sentiments. Using a multi-class sentiment model might help.
Final Thoughts
This project gave me a fascinating peek into how public sentiment varies across different platforms and topics. From interest rates to Elon Musk, it was intriguing to see how opinions shape up online — and how sentiment analysis can help us interpret the bigger picture.
The insights from mean vs. median scores and sentiment distributions were particularly eye-opening. With further refinements, this tool could be a powerful way to analyze online discussions, predict trends, or even identify market sentiment.
If you’ve ever tried sentiment analysis or have thoughts on these results, I’d love to hear them. Let’s keep exploring AI together!
Stay tuned for more adventures in GenAI!
I'm surprised that the sentiment for `r\Economics` is so low! I wonder why...
I wrote a post about fine-tuning DistilBERT a few weeks ago if that's helpful 😊 https://open.substack.com/pub/aiweekender/p/fine-tuning-a-transformer-model-for?r=2nz2lx&utm_campaign=post&utm_medium=web&showWelcomeOnShare=false
Interesting use case for AI and yes, it made me rethink...